Buy a home or rent? This is a decision faced by millions of prospective homebuyers every year, and one with dramatic financial implications, since buying a home is often the biggest financial transaction that most consumers make. Historically, most Americans have aspired to own a home, and continue to be bullish on homeownership, according to Fannie Mae’s Home Purchase Sentiment Index. Homeownership rates, which peaked at 69.2% in 2004 before falling to 62.9% in 2016, have gradually improved to 64.8%, which is closer to their historical averages.
Affordability has been viewed as a headwind for potential homebuyers, as home prices increased dramatically since the end of the Great Recession, but consumers often underestimate their “buying power,” as rising wages and falling mortgage rates help offset the rising price of homes. And since the price of renting an apartment has also continued to rise, there are actually many markets where it’s less expensive to make monthly home payments than it is to rent.
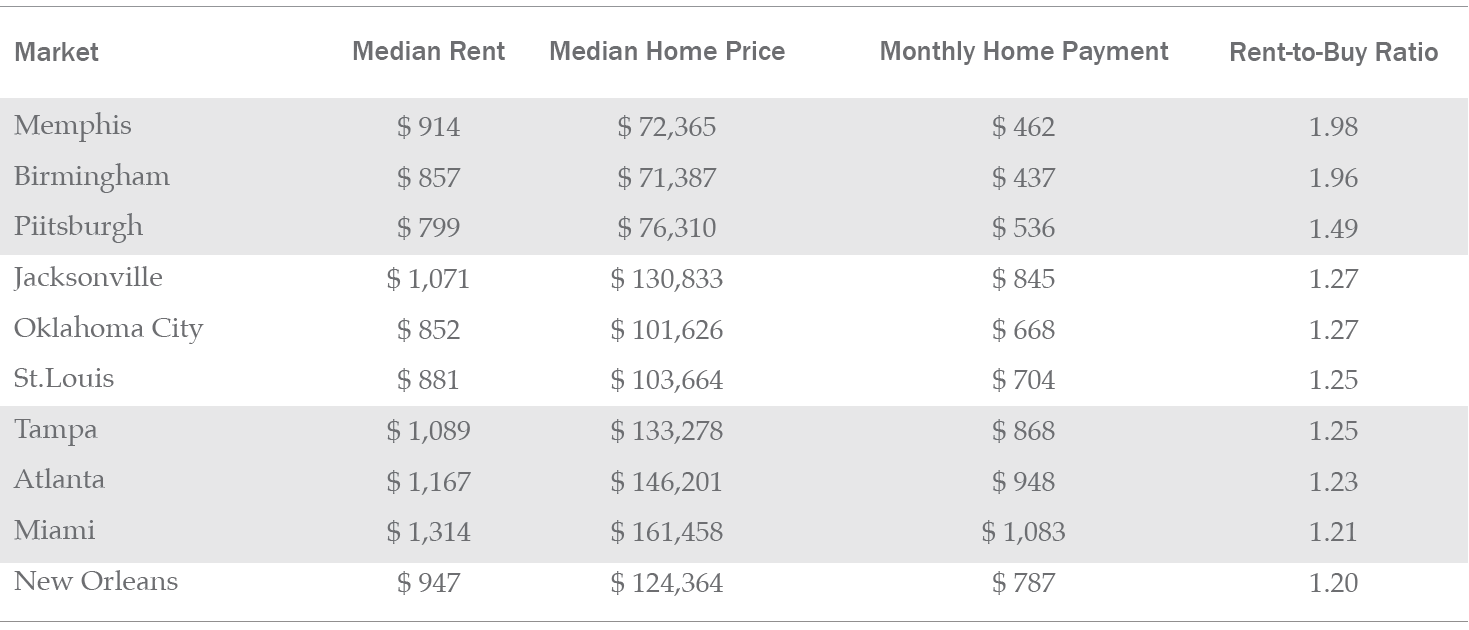
This report, prepared by CJ Patrick Company based on information from First American Data Tree®, analyzes the country’s 50 largest metropolitan areas to determine whether prospective first-time home-buyers are better off financially buying a home or renting. A variety of metrics were used in calculating the total monthly costs of renting vs. buying, including median rent price, median home sales price, taxes, and insurance. To make the calculations more realistic, home sales prices of properties in the 25th percentile were used, to be more representative of the types of properties typically purchased by first-time buyers. Total monthly payments for renting vs. buying were created, and a rent-to-buy ratio was developed using this data. A ratio above 1.0 means that a consumer would spend more on rent than on home payments; a ratio below 1.0 means that monthly home payments would be higher than rent payments.
Based on these calculations, the nation’s top 50 metropolitan areas are almost evenly split when it comes to renting vs. buying, with 24 markets presenting better buying opportunities and 26 markets skewing towards renting. Of the top 50 markets, 14 had rent-to-buy ratios between 0.9% and 1.1%, meaning that there was very little difference in the monthly costs of rent compared to home payments.
Cities in the Midwest and Southeast dominated the markets where homebuying is most cost-effective. Memphis had the highest rent-to-buy ratio, with monthly rental costs of $914 nearly twice as high as the monthly payments of $462 for purchasing a home in the 25th percentile. In addition to Memphis, Birmingham, Pittsburgh, Jacksonville, Oklahoma City, St. Louis, Tampa, Atlanta, Miami and New Orleans comprised the top 10 metro areas where monthly home payments were significantly lower than median rental payments.
Top 10 Buyer Markets
Source: DataTree by First American, U.S. Census, Federal Reserve Bank of St. Louis, IPUMS ACS
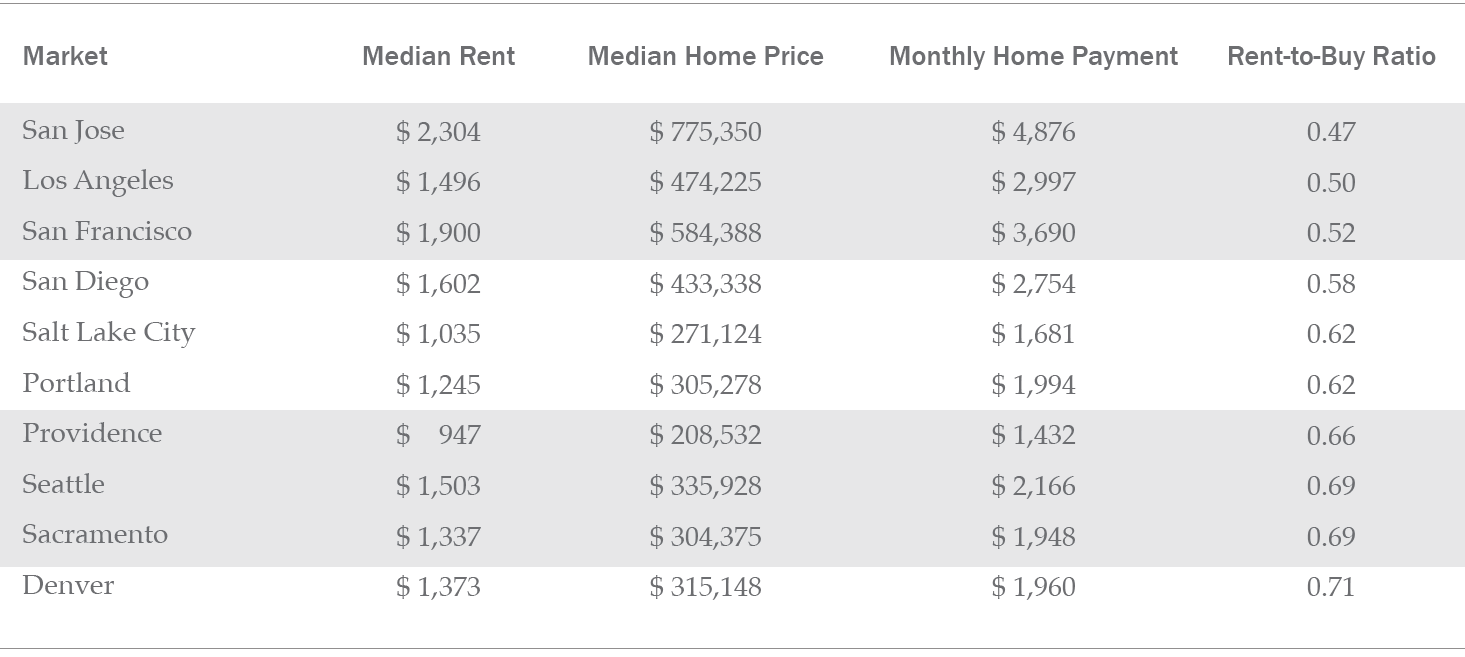
California cities dominated the top 10 metro areas where renting was more economical, claiming the top four spots in the list, and five of the top 10. Seven of the 10 were on the Pacific Coast. San Jose, which had the highest median rent payment at $2,304 a month, also had the highest monthly payment for a home purchased in the 25th percentile at $4,876, making it slightly more than twice as expensive to make monthly house payments as it is to rent. Other cities in the top 10 markets where it’s financially more affordable to rent are Los Angeles, San Francisco, San Diego, Salt Lake City, Portland, Providence, Seattle, Sacramento, and Denver. New York City’s rent-to-buy ratio was almost identical to Denver’s, but it finished just outside the top 10.
Top 10 Renter Markets
Source: DataTree by First American, U.S. Census, Federal Reserve Bank of St. Louis, IPUMS ACS
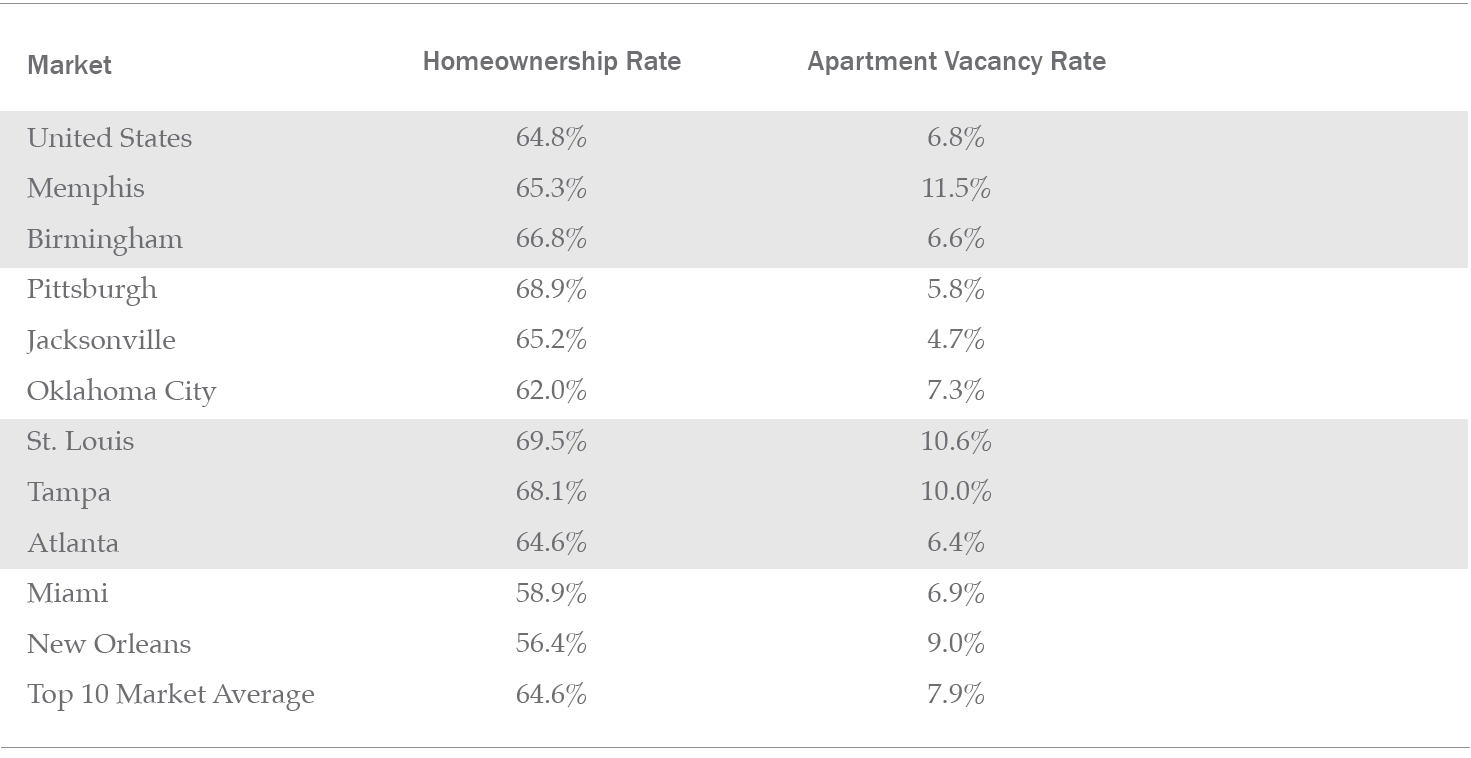
Interestingly, the buyers markets were above the national averages for both homeownership rates and apartment vacancy rates. While the national homeownership rate in the third quarter of 2019 was 64.8%, it was 65.6% among the metro areas comprising the Buyers markets. The third quarter national apartment vacancy rate was 6.8%, compared to 7.9% in those markets. This at least suggests that prospective home buyers in these markets have begun to move towards homeownership and away from renting at a slightly higher rate than the general population. Conversely, both homeownership rates (61.8%) and apartment vacancy rates (5.8%) were lower than national averages in the markets that leaned towards Renters, indicating that apartments are in higher demand in those metro areas.
Top 10 Buyer Markets
Source: DataTree by First American, U.S. Census, Federal Reserve Bank of St. Louis, IPUMS ACS
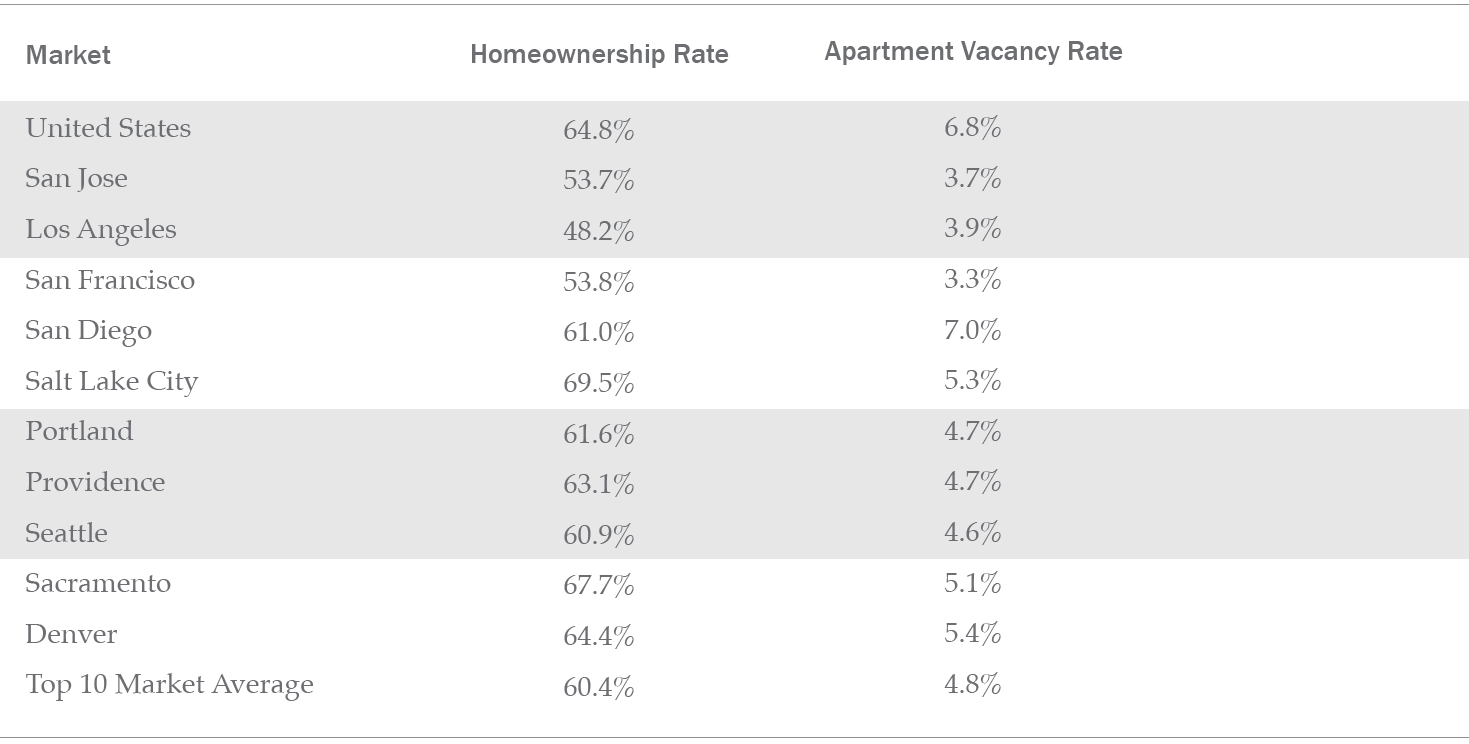
There were some outliers in the top 10 Renters markets. Los Angeles had a homeownership rate over 16 points lower than the national average at 48.2% – the lowest homeownership rate of the 50 largest metro areas. Only two of the top 10 Renters markets had a homeownership rate higher than the national average: Salt Lake City (69.5%) and Sacramento (67.7%). Nashville, which ranked 16th on the list of Renter markets, was a true exception with a homeownership rate of 72.8% – eight points higher than the national average, and the highest rate of any of the 50 markets included in the study.
Nine of the 10 markets in the top 10 Renters group had lower apartment vacancy rates than the national average. San Diego was the exception, with a 7% vacancy rate, which was slightly higher than the 6.8% national average. San Francisco had the lowest vacancy rate of the group at 3.3%, the third-lowest rate of the top 50 metro areas, trailing only Minneapolis (2.8%) and Buffalo (2.0%).
Top 10 Renter Markets
Source: DataTree by First American, U.S. Census, Federal Reserve Bank of St. Louis, IPUMS ACS
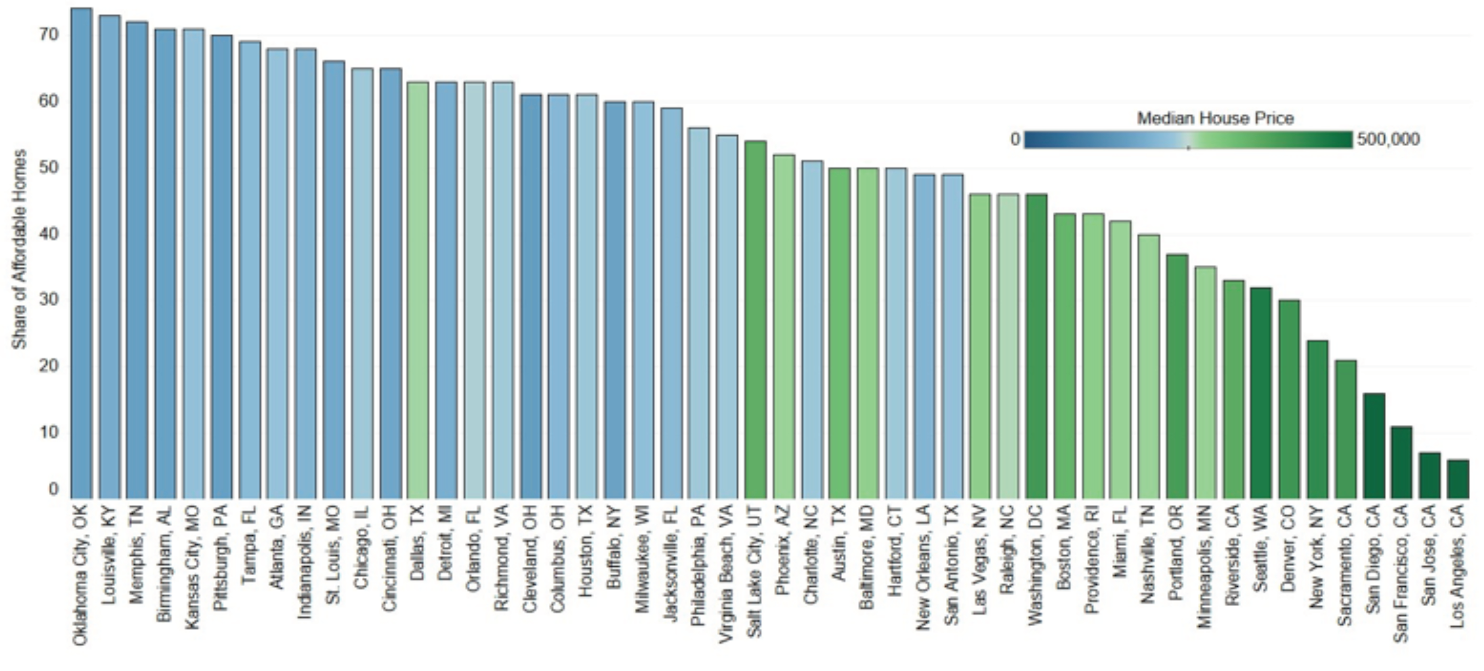
The findings of this report track closely with a recent analysis by First American’s deputy chief economist, Odeta Kushi, which identified Oklahoma City and Memphis as two of the cities where renters’ “house-buying power” allows first-time buyers to consider a much larger selection of homes to buy. The good news for prospective homebuyers is that in most of the markets having a rent-to-buy ratio that suggests homeownership, homes are more affordable, and there are often more homes to choose from.
Where can Renters Find the Largest Supply of Affordable Homes?
Median Renter: Share of Affordable Homes
Source: DataTree by First American, Standard & Poor's, Freddie Mac, Census, IPUMS CPS, Q3 2019
About the Buy vs. Rent Report
This report compares estimated monthly rental payments and home payments within the 50 largest metropolitan areas in the United States. Median rent is derived using Census microdata and home sale prices are captured from public records data. Total monthly home payments are calculated using PITI, assuming a 30-year fixed rate mortgage at a rate of 5% with a 5% down payment. The purchase price is based on median sales prices of homes at the 25th percentile, since that lower price range is more typical of properties purchased by first-time home buyers. Based on the monthly payments for a home in the 25th percentile, we create a rent-to-buy ratio, which indicates if it is cheaper to rent or buy in a particular city. The higher the rent-buy ratios, the more likely it is that monthly home payments will be cheaper than renting.
About the Author
Rick Sharga is the founder and CEO of CJ Patrick Company, which provides consulting services to real estate, financial services and technology companies, including First American DataTree, LLC. One of the most frequently quoted analysts in the real estate industry, Sharga has also held executive positions with RealtyTrac, Auction.com, Ten-X and Carrington Mortgage Holdings. For more information, visit www.cjpatrick.com.
About DataTree® by First American®
First American DataTree LLC, is a national provider of property data and document images to mortgage and real estate-related businesses. With a repository of nearly seven billion document images, First American DataTree delivers the data, property reports and document images that help bring clarity and insight to business decisions; and is committed to be the most trusted source for nationwide real estate data. More information about the company can be found at www.datatree.com.
